How to Create a Chart/Graph - continued
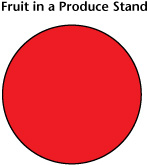
We can now use these percentages to determine how to “slice our pie”. First we draw a large circle representing all 1000 pieces of fruit, labelling it “Fruit in a Produce Stand”: |
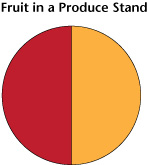
Now we need to divide this larger whole into the various individual types of fruit. First we do the Oranges: Since oranges make up 50% of the total, its “slice” takes up 50% of the pie. Make sure to label this slice “Oranges”: |
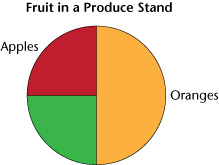
Next, we do Apples and since they take up 25% of the total, its “slice” takes up 25% of the pie: |