
How to Read a Chart/Graph - continued
But how do we read this graph more precisely? What if we want to know the average temperature in June? To do this we first locate June along the bottom scale. We then draw a vertical line upwards until it intersects the temperature line. At that point we then draw a line horizontally to the left:
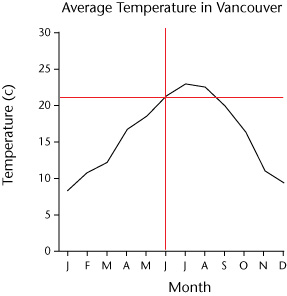
Where the line intersects the scale on the left tells us the temperature, in this case about 21° C.
Even without determining exact temperatures, this line graph also shows us that the average temperature in Vancouver is highest in July and August and is coldest in December and January.