
How to Read a Chart/Graph - continued
If we want to determine the actual average income for Quebec, we draw a horizontal line from the top of the Quebec bar to the scale along the left side:
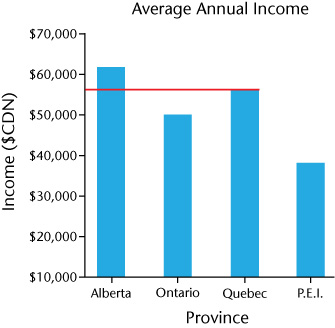
Where the line intersects the scale on the left tells us the average annual income, in this case about $56,000. (Note that we had to guess a little bit on this value. We can see that it lays a little more than half way between $50,000 and $60,000, but the graph is not precise enough to tell us the exact value. That’s okay because most graphs are intended to give a general overview